Enrolment Team Capacity Planning NZ: A COO's Guide
30 September 2026 · 6 min read
Most NZ providers can tell you their enrolment count to the learner and their SDR deadline to the day. Few can tell you how much effort a single enrolment takes. That gap is the real capacity question. With funding tight and sector work on the move, guessing is no longer safe.
Why this lands on your desk
You own the chain from enrolment form to Single Data Return. TEC requires all learners with confirmed enrolments to be reported through the SDR, including non-funded learners. Every record your team touches has a downstream consequence.
TEC describes the SDR and the Indicative Enrolment Collection as provider-based delivery data. It is used for funding, performance monitoring, published performance information, statistical reporting and policy formation. Enrolment data quality matters well beyond the admissions desk.
The default response to growth is to hire. That gets harder to defend. RNZ reported TEC warning that it will not have enough funding to cover all domestic enrolments next year, the third consecutive year of shortfall, with priority-area programmes the focus. Budget 2026 reporting says tertiary subsidies are frozen, with $284m, mostly in 2026 and 2027, to cover increased enrolments. Check the exact settings against the Budget documents rather than relying on press summaries.
There is no benchmark, so build yours
We looked for a NZ source that benchmarks enrolment or admin staffing against enrolment volumes. We didn't find one. Anyone quoting you a "right ratio" is guessing or borrowing from a different system.
That is uncomfortable, but it is also clarifying. Your ratio depends on your mix of programmes, funding types, intake patterns and how many systems your team re-keys data between. Only you can measure it.
Three numbers to baseline this quarter
You don't need a consultant or new tooling to start. You need three measurements, taken honestly, over a normal intake period.
- Touches per enrolment. Count how many times a record is opened, edited, chased or re-entered between first enquiry and a clean SDR-ready record. Sample 30 or 40 files across programmes. The spread between your easiest and hardest enrolment is usually the most useful finding.
- Rework rate. Count records sent back for correction: rejected data, inconsistent entries between systems, missing eligibility evidence. Track the cause, not just the count. A rework pile made of three recurring errors is a process problem, not a people problem.
- Knowledge concentration. List the tasks that only one person can do or explain. Who knows how a particular funding condition is applied? Who fixes the return when it fails? If the answer is a single name, that is a capacity risk your headcount figures don't show.
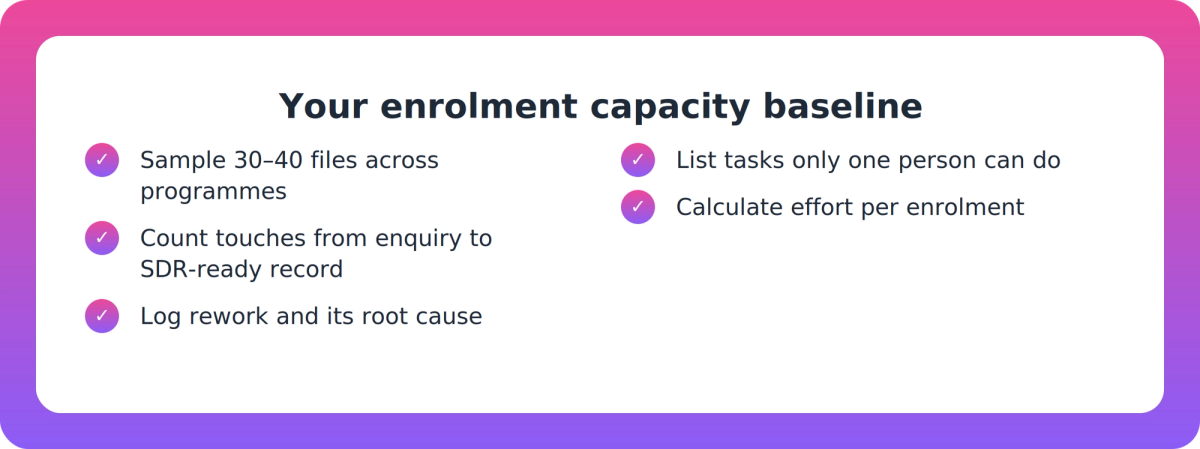
From these, effort per enrolment falls out of the sums. It is your number, built on your data, and it is the baseline any staffing decision should start from.
Why small data errors are a capacity problem
TEC's Fees Free guide gives a neat example. The qualification code must match the code reported in the SDR and match the format in STEO. So "ABC123" fails validation if the qualification is "ABC-123".
That is one hyphen. Now multiply it by every field, every system and every person keying data. Duplicate entry between systems is where these mismatches breed. Each one shows up later as a rejected return and someone's afternoon spent tracing it.
This is how a team that looks fully utilised is actually half-occupied with correction. Your rework rate tells you how much of your capacity is going to work that shouldn't exist.
TEC lists Data Specifications for SDR 2026 v3.1 and offers a TEC API portal for submitting data to its Data Exchange Platform by API. Whether any of that suits your setup is a separate decision. The point for now is that the specification is your yardstick. Any check you run against it is cheaper before submission than after.
What the next 24 months could ask of your team
Three shifts are worth sizing against your baseline.
Rules consolidation. NZQA's Private Training Establishment Rules 2026 came into force on 19 January 2026. They replace the PTE Registration Rules 2025 and the PTE Enrolment and Academic Records Rules 2022, so enrolment and academic records requirements now sit inside one rule set. The annual fee is removed, and external evaluation and review is no longer part of the framework. Ask whether your documented enrolment process still matches the new rules.
Vocational reform. Legislation passed in October 2025 disestablished Te Pūkenga, which became NZIST as a transitional entity. It also established 10 regional polytechnics and created Industry Skills Boards from 1 January 2026. ISBs can keep enrolling learners where no alternative work-based programme exists at PTEs, polytechnics or wānanga, and programmes may transition out by 1 January 2028. A PTE that picks up those programmes inherits enrolment volume with no obvious way to size the team.
Changing standards. Some sectors face unit standards changes. Industry Training Works, a secondary source, notes construction unit standards expected to expire by December 2027. Standards changes mean re-mapping and re-enrolling, which are touches your baseline should anticipate.
One caution on TEC's Data System Refresh. It was reported in March 2026 as on track for completion by August 2026, with tight timelines and resource constraints listed as risks. We haven't confirmed the outcome, so treat it as context and check TEC's current guidance.
Key takeaways
- No NZ benchmark links enrolment-team size to enrolment volume. Build your own baseline.
- Measure three things: touches per enrolment, rework rate and cause, and knowledge concentration.
- SDR data feeds funding, performance monitoring and published performance information, so enrolment errors carry real consequences.
- Small mismatches, such as a hyphen in a qualification code, fail validation and create rework.
- Funding shortfalls, frozen subsidies and possible transfer of work-based programmes by 1 January 2028 make linear hiring harder to justify.
Our take
Headcount is the most visible capacity number and the least informative. It tells you what you spend, not what the work demands. The providers that cope best with volume swings will be the ones who know what an enrolment costs them in effort before the swing arrives.
We'd go further. Rework rate is the most underrated operational metric in the sector. It is the number that tells you whether adding a person adds capacity or just adds more people correcting the same errors.
A concrete first step: pull 30 recent enrolment files this week and trace every touch. It takes an afternoon. You will learn more than from any staffing ratio someone quotes you.
FAQ
Is there an industry benchmark for enrolment team size in NZ?
Not that we could find. No NZ source we reviewed benchmarks enrolment or admin staffing against enrolment volumes. Providers need to define their own measures, such as effort per enrolment and rework rate.
Why does enrolment data quality matter beyond admissions?
TEC says SDR and Indicative Enrolment Collection data are used for funding, performance monitoring, published performance information, statistical reporting and policy formation. An enrolment error can therefore travel a long way from the original record.
What is a practical example of a data error that causes rework?
TEC's Fees Free guide says the qualification code must match the code reported in the SDR and the format in STEO. "ABC123" fails validation if the qualification is "ABC-123".
How could vocational reform affect enrolment workload?
ISBs can keep enrolling learners where no alternative work-based programme exists at PTEs, polytechnics or wānanga. Programmes may transition out by 1 January 2028. PTEs taking them on may need to absorb extra enrolment volume, which is why a baseline matters first.