Enrolments and completions are the numbers an RTO manager can produce on demand, which is exactly why they are a poor way to judge whether training works. The measures that matter more are RTO employment outcomes, the reasons learners leave, and the quality of assessment evidence. They are harder to count, but they are what learners, funders and ASQA ultimately care about.
Why this lands on your desk
You own the dashboard the board and funders see. If it leads with enrolments and completions, it can hide whether training is working. NCVER notes that many learners leave once they have gained the skills or competencies they came for. A headline completion rate can read that as failure when it is not.
There is also a regulatory angle. ASQA's 2026-27 priorities include quality sufficiency and fitness-for-purpose of training, and the integrity of qualifications and competency outcomes. Under the Outcome Standards in the 2025 Standards for RTOs, you answer for those. Outcome evidence is a risk question as well as a marketing one.
And you have no spare hours. So the aim is not more reporting. It is choosing a few measures that tell you something.
What the national data says about employment
The 2025 Standards for RTOs commenced on 1 July 2025. They comprise the Outcome Standards, the Compliance Standards (including the Fit and Proper Person Requirements) and the Credential Policy. ASQA describes the Outcome Standards as focused on the outcomes providers must achieve, across four quality areas: training and assessment, VET student support, VET workforce and governance.
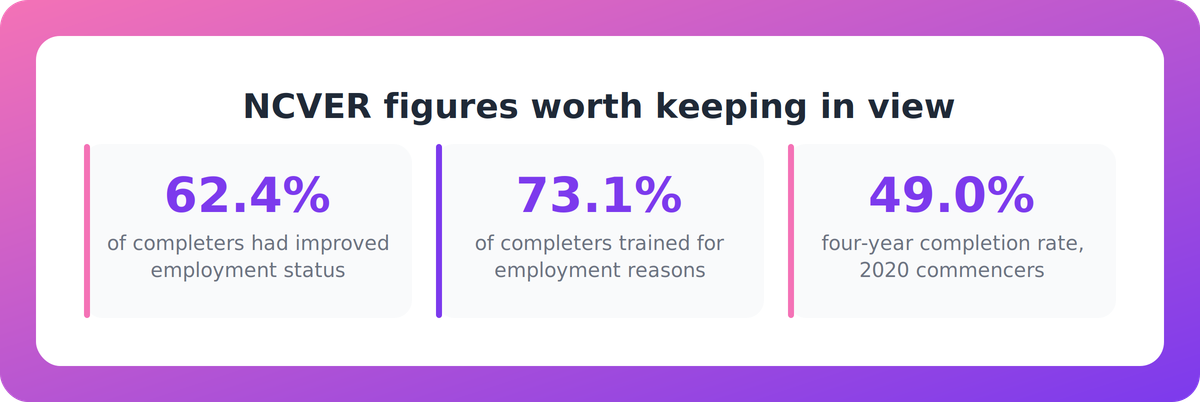
NCVER's VET student outcomes 2025 gives you two numbers worth keeping in front of you:
- 62.4% of qualification completers reported an improved employment status after training, down from 64.4% in 2024.
- 73.1% of completers trained for employment-related reasons.
The second figure is the learner's own definition of success. Most people are not enrolling for a certificate. They are enrolling for work, so employment is a fairer benchmark than enrolment volume.
Read every number in context
That fall from 64.4% to 62.4% is not automatically a sign that providers got worse. NCVER links it to the rise in unemployment. If your own graduate employment result slips, check the labour market before you check your trainers.
The same discipline applies to volume. In 2025, NCVER recorded 845,165 qualification completions, down 4.8%. The fall was driven mainly by an 11.3% drop in domestic fee-for-service completions. Government-funded students fell 6.7% to 1,137,645.
In a contracting market, enrolment growth is an unreliable health check. A flat intake might be strong performance. A rising one might be a discount that will not last.
The national four-year completion rate for qualifications commencing in 2020 was 49.0%, up from 47.5% for 2019. It is a useful benchmark. But it is a lagging cohort measure, so it tells you what happened years ago, not what to fix this term.
Non-completion is not always failure
Completion still matters. But the data does not support treating every non-completer as a loss.
NCVER's apprentice and trainee outcomes 2025 shows the gap in employment terms:
- Trade: 94.8% of completers were employed after training, versus 80.8% of non-completers.
- Non-trade: 89.2% of completers, versus 70.4% of non-completers.
Completers do better, and the gap is real, especially for non-trade. But employment among non-completers is still strong. The sensible response is to track both groups rather than write one off.
Then look at why people leave. Among part-completers, 38.4% cited training-related reasons such as better support, flexibility and workload. Those are levers you can actually pull. An exit reason you can change is worth more to you than a completion percentage you can only observe.
The integrity guardrail
Pressure to lift completions has a downside. ASQA's 2025-26 priorities flagged RPL issued without appropriate assessment as an enduring and growing risk. The 2026-27 priorities keep the integrity of qualifications and competency outcomes in view.
A completion rate that rises because assessment evidence thins out is not an improvement. It is a risk you have not found yet. Any scorecard that rewards completions should sit next to one that tests the evidence behind them.
A scorecard you can run this quarter
You do not need a new reporting layer. Try five measures, drawing on external data you already have access to:
- Graduate employment outcomes. Track your own completers' results and set them beside NCVER's national figures. Compare like with like, and note the labour market conditions.
- Reasons for leaving. Split exits into training-related reasons (support, flexibility, workload) and reasons outside your control. Act on the first group.
- Completers and non-completers together. Look at employment for both, by qualification, not just the completion count.
- Evidence integrity checks. Sample assessment and RPL files each quarter and record what you find. Report the result to your board.
- Enrolments, last. Keep them on the page, but read them against the shrinking market, not against last year alone.
Five lines is a dashboard a busy manager will actually open.
Key takeaways
- Enrolments and completions are easy to count but weak proxies for whether training works.
- NCVER reports 62.4% of 2025 completers had an improved employment status (down from 64.4%), a fall it links to higher unemployment. Read your own result against the labour market.
- 73.1% of completers trained for employment-related reasons, so employment is the learner's own measure of success.
- Many learners leave after gaining the skills they need. Track why they leave, and track employment for non-completers as well as completers.
- ASQA's priorities on fitness-for-purpose and competency outcome integrity mean completion gains must be backed by sound assessment evidence.
Our take
The sector has spent years optimising for what is easy to report. We think that has quietly shifted the manager's job from running good training to running good numbers. Employment outcomes will always be messier than a completion count. They depend on the labour market, on survey response and on factors you do not control.
But messy and meaningful beats tidy and hollow. A scorecard that shows graduate employment, reasons for leaving and evidence quality gives you something you can defend to a board and to ASQA. It also tells you what to change on Monday. Completions should stay on the page, but as one number among five, never as the headline.
FAQ
What are RTO employment outcomes, and where do I find benchmarks?
They describe whether learners got work, or improved their employment status, after training. NCVER's VET student outcomes 2025 reports that 62.4% of qualification completers had an improved employment status, and its apprentice and trainee outcomes publication gives employment results for completers and non-completers.
Does a fall in my graduate employment result mean my training has declined?
Not necessarily. NCVER links the national fall from 64.4% to 62.4% to higher unemployment. Check labour market conditions first, then look at your own exit reasons and assessment evidence before drawing conclusions.
Should I stop tracking completion rates?
No. Keep them, but read them as one measure. The national four-year completion rate for 2020 commencers was 49.0%, a useful benchmark but a lagging one. Pair it with employment outcomes and the reasons learners leave.
How does ASQA's focus affect how I use outcome data?
ASQA's 2026-27 priorities include fitness-for-purpose and the integrity of qualifications and competency outcomes. If you push completions up, make sure the assessment evidence, including any RPL, holds up. Outcome data and evidence checks belong on the same scorecard.