The scaling wall in practical skills delivery is rarely a demand problem. It's a design problem. Supervised practice and assessor time tend to grow with every learner, while reporting load grows with every system and rule change. Add headcount in step with enrolments and margin erodes quietly. The first job is to find out which costs actually follow the learner.
One caveat up front. Our research found no authoritative Australian data on how delivery cost scales with enrolments. Treat what follows as a hypothesis and a set of questions to test against your own numbers, not a measured finding.
Why this lands on your desk
You own the capacity model. If trainer and assessor time rises roughly in step with each learner doing practical units, growth looks great in the enrolment report and mediocre in the P&L.
You also answer for reporting. The move from AVETMISS to the VET Information Standard lands in the same team and budget as delivery capacity. Data will move by API between student management systems, state and territory training authority systems and NCVER, replacing manual NAT file extraction and submission. STARS replaces AVETMISS Validation Software.
And you are judged on resilience under regulation. The 2025 Standards for RTOs took effect on 1 July 2025. ASQA says its approach has shifted to match the outcomes focus, with more flexibility in how providers show they meet the Standards, alongside more regulatory engagement. It is also cancelling the registration of critically non-compliant providers. Cutting cost per learner can't weaken your evidence of outcomes.
Enrolments are not the growth signal you think they are
Before designing for scale, check what kind of volume you are scaling for. NCVER reports 5.1 million students in nationally recognised VET in 2025, up just 1,585 on 2024. Underneath that flat headline, students in qualifications fell by 108,360 and qualification enrolments fell by more than 5%. Short courses and stand-alone subjects grew.
The mix is uneven by segment too:
- Government-funded students fell 6.7% to 1,137,645, and program enrolments fell 9.2%.
- VET in Schools grew 4.1% to 276,860 students, the highest since the collection began in 2006.
If your growth plan assumes more qualification learners arriving in a steady line, test that assumption. Capacity may need to flex between segments, not only climb.
Two cost curves, two different problems
It helps to separate costs by what drives them. Mixing them is how firefighting becomes a permanent operating model.
Costs that follow the learner
Supervised practice hours, assessor observation time, workplace-style scenarios and the coordination around them. These are your scarcest inputs, and they tend to rise with each learner doing practical units. Hiring more assessors is the default response. It is also the one that locks in a linear cost curve.
Costs that follow the system
Duplicate data entry, manual reporting cycles, rework before submission, and process knowledge sitting in one person's head. These grow with every extra system and every rule change, not with every learner. They are the cheapest to fix and the easiest to ignore, and the VET Information Standard transition is about to test them.
Four measures to pull this quarter
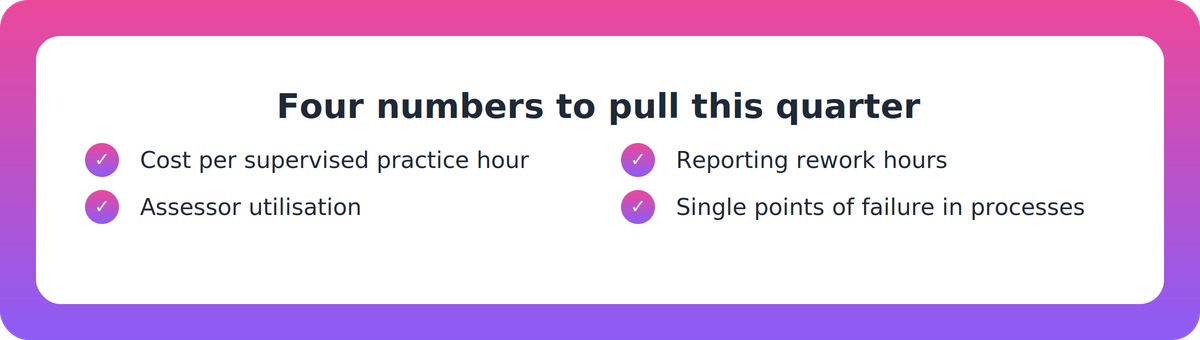
You don't need a consultant to start. You need four numbers, cut by qualification and delivery mode.
- Cost per supervised practice hour. Include assessor time, coordination and any external costs.
- Assessor utilisation. How much paid time is spent assessing, and how much on scheduling, chasing and re-entering data?
- Reporting rework. Hours spent correcting and reconciling data between systems before each submission.
- Single points of failure. Which processes only one person can run?
If measure one barely moves as cohorts grow, you have a headcount-linear model. If measure three is large, part of your wall is plumbing, not pedagogy.
Redesign without thinning the evidence
The 2025 Standards' outcomes focus gives you more room to decide how outcomes are achieved. You still have to evidence them. That is where cost-cutting turns risky.
A secondary source (RTO Resource Australia, which should be checked against ASQA's own page) lists ASQA's 2025–26 risk priorities as including RPL, shortened duration and work placement. Shaving practical assessment is the fastest way to cut cost per learner. It also sits close to those areas.
So redesign the surrounding load instead. Look at how practice is rehearsed before the assessed event, how scenarios are produced and refreshed, how observation is scheduled, and how evidence flows into records without re-keying. Any change to assessment has to be checked against the unit of competency and training package requirements. Quality then stays intact while the per-learner effort falls.
On reporting, NCVER says RTOs keep managing activity data in their existing student management system but need a VET data system that can collect, store and report Standard data digitally. ASQA says the amended Data Provision Requirements Instrument came into effect on 1 October 2026. NCVER says all RTOs must report under the new standard by January 2029. Secondary sources give slightly different final dates, so confirm them in the instrument itself.
Key takeaways
- The scaling wall is a design problem: some costs follow each learner, others follow each system and rule change.
- No authoritative Australian data measures how delivery cost scales with enrolments, so measure it in your own RTO.
- NCVER's 2025 data shows total VET students nearly flat (up 1,585) while qualification enrolments fell by more than 5%, so don't assume qualification growth.
- Pull four numbers: cost per supervised practice hour, assessor utilisation, reporting rework and single points of failure.
- Redesign the load around assessment, not the assessment itself. ASQA still expects evidence of outcomes under the 2025 Standards.
Our take
Most RTOs treat headcount as the only dial on practical delivery capacity. We think that's a habit, not a law. The outcomes focus of the 2025 Standards makes it a more expensive habit to keep, because it rewards providers who can show how quality outcomes are achieved, not just how many people were employed to achieve them.
The uncomfortable part is that you can't know how bad your wall is until you measure it, and most RTOs haven't. Start with the four numbers. Then decide whether next year's growth plan is a hiring plan or a design plan.
FAQ
What is the "scaling wall" in vocational training delivery?
It's the point where costs of practical delivery grow as fast as, or faster than, enrolments. The likely drivers are supervised practice, assessor time and scenario preparation that rise with each learner, plus admin and reporting load that rises with each system and rule change. It's a hypothesis to test internally, not a measured Australian finding.
Is there data on how delivery costs scale with enrolments in Australian VET?
Our research found no authoritative Australian source. NCVER publishes enrolment and student data, but not cost curves. Measure your own cost per supervised practice hour, assessor utilisation and reporting rework instead.
Can I cut practical assessment to reduce cost per learner?
Be careful. The 2025 Standards for RTOs give more flexibility in how outcomes are achieved, but you must still evidence them. A secondary source lists RPL, shortened duration and work placement among ASQA's 2025–26 risk priorities, so confirm those with ASQA. Redesign the supporting load first.
When do I need to report under the VET Information Standard?
ASQA says the amended Data Provision Requirements Instrument came into effect on 1 October 2026. NCVER says all RTOs must report under the new standard by January 2029. Other sources quote different final AVETMISS dates, so confirm the exact dates in the instrument.