Most RTO margin pressure gets filed under cost. It is also a denominator problem. NCVER reports that qualification enrolments fell by more than 5% in 2025, so the same delivery and compliance cost base is spread across fewer qualification students. Tracking RTO cost per student alone tells you the margin is thin. It doesn't tell you where it went.
Why this lands on your desk
You own the P&L, and the board will ask about cost per student. NCVER's *Total VET students and courses 2025* shows 5.1 million students in nationally recognised VET, up only 1,585 on 2024. The domestic participation rate for ages 15–64 slipped to 26.4%. Within that flat total, qualification enrolments fell in every jurisdiction, across TAFEs, community providers and private providers.
You are also personally exposed. ASQA emails the Annual Declaration on Compliance link to RTO CEOs. It issued a Statement of Regulatory Expectations on 7 May 2026 covering Fit and Proper Person Requirements and the duty to notify material changes.
One caveat up front. The research behind this piece contains no sector-wide cost-per-student or cost-per-placement figures. NCVER doesn't report provider cost data. This is a metric you build from your own books, and anything below about cost structure is inference, labelled as such.
The denominator is moving
If your delivery and compliance costs are largely fixed, fewer qualification students means a higher cost for each one. That is an inference, not an NCVER finding. But it looks structural rather than a one-off blip, and it is worth modelling as if it is.
The growth sits in specific places. VET in Schools reached 276,860 students in 2025, up 4.1% and the highest since 2006. NCVER also points to growth among regional and remote, disability and First Nations students.
The research doesn't say what these cohorts cost to deliver. That is a question for your data. If your pipeline is tilting toward them, are the extra support, travel or supervision hours showing up in your margin by cohort, or are they buried in an average?
Headline cost per student hides the delivery line
A sharper measure is the cost of getting a learner to a competent, defensible outcome. That moves your attention to the delivery line, where cost accumulates in four places:
- Practice: how learners rehearse the skill before it counts.
- Assessment: collecting, judging and moderating evidence.
- Feedback: how fast and how specifically learners hear what to fix.
- Supervision: workplace, simulated or trainer-observed oversight.
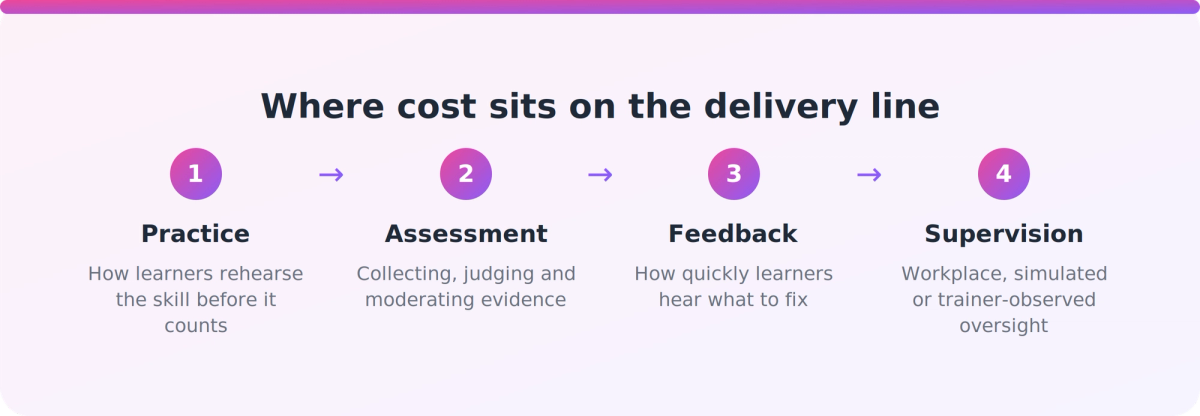
Pick one qualification and trace a cohort through those four steps this quarter. Capture trainer and assessor hours, resubmissions, rework and time from enrolment to evidenced competency. You will likely find the cost isn't spread evenly, and the average will have been hiding it.
The compliance cost you must carry versus the cost you choose
DEWR lists three elements in the 2025 Standards for RTOs: the Outcome Standards, the Compliance Standards (which include the Fit and Proper Person Requirements) and the Credential Policy. ASQA-regulated RTOs are regulated against the Outcome and Compliance Standards instruments made in 2025. ASQA's webinar transcript describes 19 Practice Guides, all now final.
DEWR also notes that its policy documents do not impose legal obligations. Read that narrowly. It doesn't make guidance irrelevant, and it doesn't tell you what an auditor will accept. It does mean that when you price compliance, you should know which spend answers the legislated standards and which is a choice about how to meet them.
Governance and AI: exposure that cost per student won't show
ASQA is running an ongoing program against non-genuine and bad-faith providers. WA's TAC Update 119 reports qualification cancellations in early childhood, aged care, disability support, construction and automotive. That can mean students seeking credit based on cancelled qualifications, or staff whose credentials were affected. Trade press (The Sector) reports closer scrutiny of late ownership and governance disclosures.
On AI, ASQA asked at its 2026 sector workshops whether an RTO's use of AI complies with the 2025 Standards. It has since released guidance built around five principles. WA's TAC Update 123 reports that it creates no new requirements and helps RTOs meet existing obligations. The principles themselves aren't reproduced here, so read them on ASQA's website.
The practical test is simple. Any AI used in delivery, assessment or back-office work should be something you can explain, in plain terms, against obligations you already carry.
Funding: plan around what you don't know
The Fee-Free TAFE Skills Agreement delivers $1.5 billion for over 500,000 places from 2023 to 2026. The research doesn't cover what follows or how it affects private RTOs. Treat that as a planning uncertainty. Run two or three enrolment scenarios rather than betting on one forecast.
Key takeaways
- Qualification enrolments fell by more than 5% in 2025 (NCVER), so fixed delivery and compliance costs sit across fewer qualification students.
- No sector benchmark for cost per student or per placement exists in the research. Build the metric from your own data.
- Track cost to a competent, defensible outcome, and break it down across practice, assessment, feedback and supervision.
- Growth cohorts (VET in Schools, regional and remote, disability, First Nations) may cost differently to deliver. Check your own numbers.
- Governance and AI scrutiny are live. ASQA's AI guidance is reported to add no new requirements.
Our take
Stop managing cost per student as a single number. It rewards cutting the wrong things and hides the right ones. Cost per defensible outcome is harder to calculate, but it is the one that connects your margin to your regulatory standing.
Our hypothesis, which your data may overturn, is that practice and feedback deserve the closest look. They tend to scale with people-hours, and they sit closest to whether a learner is genuinely competent. That is a view, not a finding.
A first step for this week: ask your Head of Training for the hours spent per learner on those four delivery steps in your largest qualification. If nobody can answer quickly, that is the finding.
FAQ
What is a good RTO cost per student benchmark?
The research behind this article found no sector-wide cost-per-student or cost-per-placement benchmark. NCVER reports enrolments and participation, not provider costs. The credible approach is an internal baseline by qualification and cohort, tracked over time.
Why is RTO cost per student rising?
The research doesn't measure it directly. NCVER shows qualification enrolments fell by more than 5% in 2025 while overall VET participation stayed flat. If your costs are largely fixed, fewer qualification students will push cost per student up. That is an inference, not a reported figure.
Does ASQA's AI guidance add new compliance requirements?
It is reported not to. WA's TAC Update 123 says the guidance, built around five principles, creates no new regulatory requirements and helps RTOs meet existing obligations. ASQA also asked at its 2026 workshops whether AI use complies with the 2025 Standards. Read the guidance on ASQA's website.
What should a CEO measure instead of cost per student?
Measure the cost of getting a learner to a competent, defensible outcome. Break it down by practice, assessment, feedback and supervision, and compare across qualifications and learner cohorts using your own data.