Completion rates usually get filed under learner engagement or marketing. The more useful reading for an RTO Manager is that they may be a resourcing signal: how much trainer, assessor and compliance capacity you can put behind each learner. No authoritative source proves the link. It is still the lens worth testing against your own data.
Why this lands on your desk
You answer for RTO completion rates, quality and risk with a fixed pool of trainers, assessors and admin staff. When a new obligation arrives, it doesn't come with its own people. It draws on the same ones who chase a stalled learner, give feedback on an assessment or run a workplace visit.
The 2025 Standards for RTOs took effect on 1 July 2025. They bring Outcome Standards, Compliance requirements (including Fit and Proper Person Requirements) and a Credential Policy. ASQA's position is that providers must show compliance against the Standards in effect when a decision is made. Deferring that work is no longer a neutral choice.
ASQA is also cancelling the registration of critically non-compliant providers. In 2026 it released a statement of regulatory expectations on fit and proper person requirements (7 May) and sought information on workplace assessment quality (23 March). Each of those lands on the same scarce people.
What the NCVER data can and can't tell you
NCVER waits four years after commencement before it reports observed actual completion rates, so recent figures are projections. That makes completion a lagging measure. A resourcing decision you make this term will show up in published numbers years from now. NCVER's latest release, VET qualification completion rates 2025, covers nationally recognised qualifications at Certificate I or higher. I haven't quoted its headline figure here, so check the full release on the NCVER website.
The context matters more than the headline. In the 2018 qualification cohort (published December 2020, so dated), 41.4% of qualifications were completed overall. The rate was 46.6% for government-funded domestic qualifications and 33.5% for domestic fee-for-service. By field, it ranged from 59.5% for natural and physical sciences to 31.9% for architecture and building.
That spread says a single rate means little without your learner mix, funding source and field of delivery behind it. It also says something blunt about benchmarking. If you compare yourself to a national average, you may be comparing against a very different delivery model.
The people who support completion are the people everyone is asking more of
The Jobs and Skills Australia VET Workforce Study (October 2024) found almost half the VET workforce is over 50. The average age is 47, against 41 for the Australian workforce. Just under half (48.5%) work in Teach, Train and Assess roles.
Recruiting replacements is hard. Skills Insight (2025) reports that training providers struggle to attract suitable applicants and have a lower vacancy fill rate than universities and schools. It also notes that core VET workforce datasets are unavailable, so even the sector's own picture is patchy. Industry Skills Australia reports a significant shortage of qualified Teach, Train and Assess professionals in regional, rural and remote areas. It says the cost and complexity of the Certificate IV in Training and Assessment deter entrants.
There is a quieter draw as well. Industry Skills Australia notes that digital change raises the time and cost of maintaining vocational currency. That is trainer time that doesn't appear on any timetable.
Demand is not easing either. The Australian Government has committed over $1.6 billion to 2034-35 to support at least 100,000 Free TAFE and VET places a year from 2027. Fee-Free TAFE has recorded more than 851,000 enrolments and 276,990 completions to 30 June 2026, and the Department of Employment and Workplace Relations (DEWR) expects completions to rise as part-time and longer-course students finish. More learners, a harder-to-recruit workforce and a heavier compliance load all pull on the same capacity.
A diagnostic you can run this quarter
Here is the honest caveat. The research found no authoritative source that directly measures how RTO staffing or resourcing affects completion. Treat what follows as a hypothesis to test, not a finding to quote to your board.
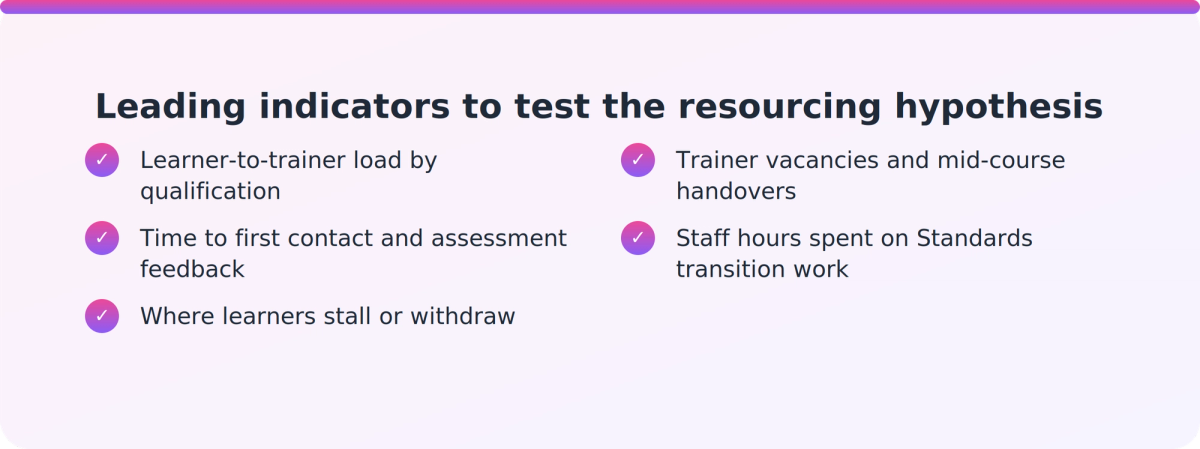
Start with leading indicators you already hold, because the published rate will arrive too late to help. These are suggestions, not prescribed measures:
- Learner-to-trainer load by qualification. Is attrition clustering where one trainer or assessor carries the heaviest caseload?
- Time to first contact and to assessment feedback. Where does a learner wait longest, and do they leave after those waits?
- Where learners stall. Compare the point of withdrawal or inactivity with when your staff were pulled onto compliance work.
- Vacancies and handovers. Do cohorts that lost or changed a trainer mid-course complete at a different rate?
- Compliance hours. Roughly how many staff hours went to Standards transition work, and from which roles?
If the pattern isn't there, you've ruled out a theory cheaply and can look at learner selection, course design or employer engagement instead. If it is there, you have a case for where scarce capacity should go.
Key takeaways
- NCVER reports observed completion four years after commencement, so the published rate is a lagging measure and a weak early-warning tool.
- Completion varies sharply by funding source and field (2018 cohort: 46.6% government-funded domestic versus 33.5% domestic fee-for-service), so national averages are a rough benchmark at best.
- The VET workforce is ageing and hard to recruit into, and the 2025 Standards and ASQA's integrity focus draw on the same people who support learners.
- No authoritative source directly links RTO resourcing to completion. Treat it as a hypothesis and test it with your own data.
- Build leading indicators (caseload, feedback turnaround, stall points) rather than waiting for the published figure.
Our take
The sector talks about completion as something learners do, or fail to do. We think a good share of it is something an RTO makes possible, and that managers have more control over it than the marketing-and-engagement framing suggests. We can't prove that. Nobody can yet.
But the framing changes what you do on Monday. Instead of asking how to motivate learners, you ask where your capacity is being spent and whether it is the right place. Some compliance work is non-negotiable under the 2025 Standards. The task is to see clearly what it costs, so the trade-off is a decision you make and not one that happens by default.
A concrete first step: pick one qualification with weak completion and map its learner drop-off points against staff availability for a single term. One cohort, one afternoon. What would you need to see to change how you allocate your people?
FAQ
Do RTO completion rates show how well my RTO is resourced?
Not reliably. NCVER data shows completion varies widely by funding source and field, and no authoritative source directly measures the effect of staffing on completion. Use resourcing as a diagnostic lens and test it against your own caseload and attrition data.
Why can't I use NCVER completion figures to manage this term?
NCVER waits four years after commencement before reporting observed actual completion rates, so recent figures are projections. Managing in real time needs internal leading indicators, such as feedback turnaround and learner inactivity.
Should I compare my completion rate to the national figure?
Treat it with caution. In NCVER's 2018 cohort, completion was 46.6% for government-funded domestic qualifications and 33.5% for domestic fee-for-service. By field it ranged from 59.5% to 31.9%. Your learner mix and funding source determine which comparison is fair.
How do the 2025 Standards affect trainer and assessor capacity?
The Standards took effect on 1 July 2025, with Outcome Standards, Compliance requirements including Fit and Proper Person Requirements, and a Credential Policy. Meeting them draws on the same trainers, assessors and administrators who support learners, so the time cost is worth tracking.