Your board sees revenue, enrolments and audit status. It almost certainly doesn't see what it costs to take one student from enrolment to compliant completion. That gap hides where your margin leaks, and no public benchmark will fill it. RTO cost per student has to be built internally and split into delivery, compliance and administration.
Key takeaways
- No authoritative public benchmark exists for RTO cost per student, so the figure has to come from your own finance and student data.
- A single blended number is not enough. Split it into delivery, compliance and administration, or you can't see which one is squeezing margin.
- Falling qualification enrolments and shrinking government-funded volumes can change your unit economics, but NCVER doesn't say how. Only your own data can.
- Outcome-based regulation under the 2025 Standards makes compliance cost something you should measure per student, including how much of it rests on a few key people.
- Any AI or technology spend should be tested against the administration and compliance lines of this baseline. Accountability stays with named people.
Why this lands on your desk
You own the P&L and answer to the board for margin. When margin tightens, you probably feel it before you can locate it. Revenue is up or flat, audits are clean, and yet the surplus is thinner.
That is what happens when cost per student isn't a standing board metric. Without it, "compliance is getting more expensive" or "delivery costs are rising" stay as impressions rather than line items you can act on.
There is a plain fact to start from. The research behind this post found no authoritative public figure for RTO cost per student, delivery cost per enrolment, operating margin by provider type, or the cost of compliance under the 2025 Standards. Don't wait for an industry number to compare against. Build your own.
What the market is doing to your unit economics
Participation is high, but the shape of it is changing. NCVER reports more than 5.1 million students in nationally recognised VET in 2025, with qualification enrolments down by more than 5%. Its 2025 student data shows students in qualifications falling by 108,360 while short courses and stand-alone subjects grew. Commencing qualifications made up 61.2% of qualification enrolments, down 2.3 percentage points from 2024.
Government-funded VET fell to 1,137,645 students in 2025, a decrease of 82,170 (6.7%), according to NCVER.
NCVER doesn't say what any of this does to margins. The inference is ours: a shifting mix and fewer funded students can change what each student costs you. If you rely on government-funded delivery, fewer students are carrying much of the same fixed cost base.
Here is an illustrative example, not real data. Say $1.2 million of fixed costs sits behind 1,000 students: $1,200 each. If volume falls to 900, the same costs become about $1,333 each, before anything else changes. Whether your fixed costs are really that rigid is exactly what you need to find out.
Split the number three ways
A blended figure tells you little. Three buckets tell you where to act.
- Delivery: trainer and assessor time, facilities, learning resources, work placement coordination.
- Compliance: evidence gathering, validation, self-monitoring, audit preparation, professional development to maintain currency.
- Administration: enrolment, records, reporting, student queries, invoicing and follow-up.
The split matters because the buckets respond to different decisions. Delivery cost responds to workforce and course design. Compliance cost responds to how evidence is captured and who holds the knowledge. Administration cost is where manual rework tends to hide.
How to build the number in a month
You don't need a perfect model. You need a defensible first version your finance lead and your training and compliance leads agree on.
- Choose one cohort or course family, ideally one that represents a big share of your revenue.
- Pull the direct costs and allocate staff time using timesheets or honest estimates from the people doing the work.
- Tag each cost to delivery, compliance or administration.
- Divide by students who reached a compliant completion, not just those who enrolled.
- Repeat for a short course and a qualification, then compare.
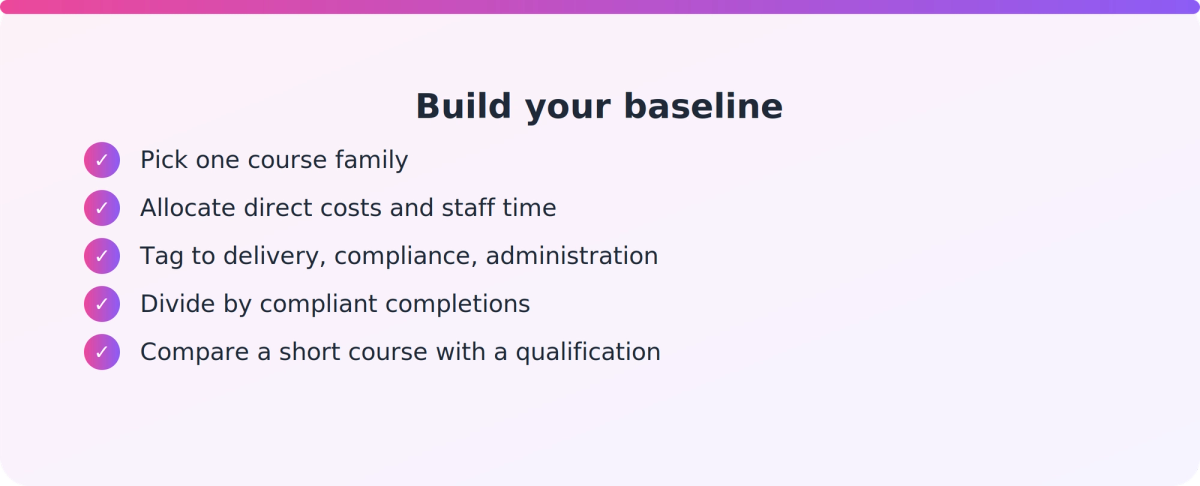
Step four is the one most providers skip. Enrolled students who don't complete still consumed delivery, admin and often compliance effort. If the denominator is completions, attrition shows up as cost.
What the 2025 Standards do to compliance cost
Since 1 July 2025, ASQA-registered RTOs have been measured against the Outcome Standards for RTOs Instrument 2025: 23 standards across four quality areas covering training and assessment, VET student support, VET workforce and governance. ASQA's Corporate Plan calls embedding them its most significant regulatory priority and describes a shift from prescriptive compliance to outcome-based regulation that requires genuine cultural change.
For you, that raises two questions. What does staying audit-ready cost per student? And how much of that depends on one or two people who hold it all in their heads? Key-person risk is a cost you haven't priced yet.
The workforce side adds pressure. The JSA VET Workforce Study describes an older, ageing and highly casualised workforce. ISA's VET Workforce Project reports that digital transformation is raising the time and cost for trainers and assessors to maintain vocational currency. ISA's project covers transport and supply chain, so treat it as indicative for your sector. Either way, it all sits inside your delivery and compliance lines.
Where AI belongs in the number
You are being asked what AI means for the business. The baseline gives you a disciplined answer.
ASQA's responsible use principles introduce no new regulatory requirements. They state that AI must not replace human decision-making, evaluation or accountability. ASQA lists administrative efficiencies as an opportunity, and academic integrity, data privacy and implementation costs as risks. Its case studies include an RTO combining written and verbal evidence to protect assessment integrity.
So the sensible test is narrow. Look for savings in the administration line and the evidence-handling part of compliance. Keep judgement about competency with named, accountable people. If you can't say what an administrative task costs per student today, you can't say whether a tool paid back.
Our take
Boards ask whether the RTO is compliant and growing. They should also ask what each student costs, by bucket, and whether it's moving. We think this should sit on the board pack next to revenue.
The number will be imperfect, and that is fine. A rough internal baseline you trust beats an industry benchmark that doesn't exist. The real risk is carrying on without one while mix, funding and regulatory expectations all shift at once.
FAQ
Is there an industry benchmark for RTO cost per student?
The research for this post found no authoritative public benchmark for cost per student, delivery cost per enrolment or compliance cost under the 2025 Standards. You need to build the figure from your own financial and student data.
Should cost per student use enrolments or completions?
Use completions as the denominator at least once. Students who enrol and don't complete still consume delivery, admin and often compliance effort, so enrolment-only figures hide attrition cost.
Does a shift to short courses lower or raise margin?
NCVER shows demand moving towards short courses and stand-alone subjects, but it doesn't say what that does to margin. Compare cost per student for a short course and a qualification in your own data.
Can AI reduce cost per student without breaching ASQA expectations?
ASQA's principles add no new requirements and name administrative efficiency as an opportunity. They also state that AI must not replace human decision-making, evaluation or accountability, so savings belong in administration, not in assessment judgement.
Next step
This week, ask your finance lead and your head of training to pick one course family and work through the five steps above together. Bring the first rough delivery, compliance and administration split to your next board meeting, flaws and all, and ask what the board would want to see monthly.