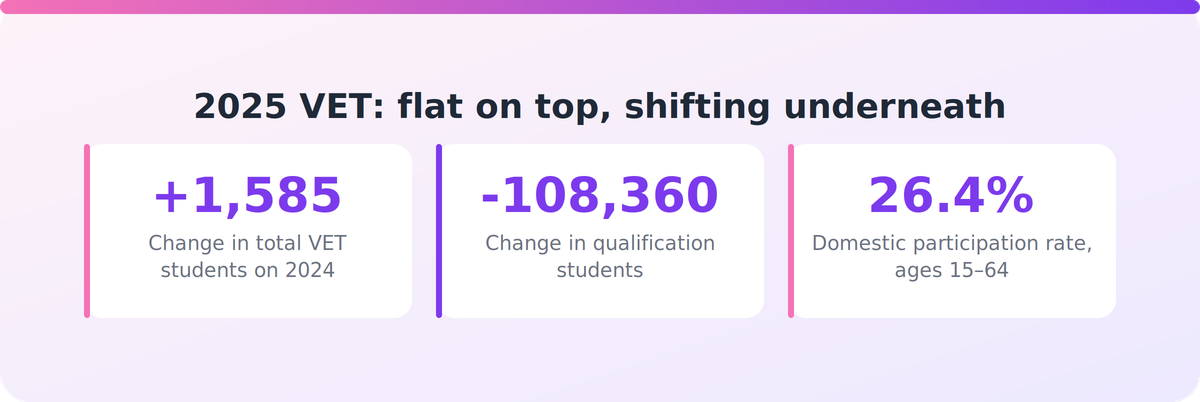
Last year's intake plus a growth percentage is not an enrolment forecast. The 2025 national data shows why: total VET students rose by just 1,585 to 5.1 million, yet qualification students fell by 108,360. The market didn't stand still. Its mix moved, and your margin lives in the mix.
Why this lands on your desk
You own the P&L and you answer to the board for growth. A forecast built on a flat national total can hide a large swing in the cohorts or qualifications your margin depends on.
Cost per student follows mix too. If activity is drifting toward school-age, regional and part-qualification enrolments while qualification enrolments fall, your delivery and compliance cost assumptions need re-basing, not just your volumes.
Then there's regulatory standing. Audit outcomes, governance and key-personnel changes can affect your ability to enrol and issue credentials. That makes standing a pipeline risk, and it belongs in the forecast.
And if student, funding and compliance data sit in separate places, the forecast is usually one person's spreadsheet. That is key-person risk wearing a finance hat.
A flat total hides a moving mix
NCVER's *Total VET students and courses 2025* reports 5.1 million domestic and international students in nationally recognised VET, up 1,585 on 2024. The domestic participation rate for people aged 15–64 slipped to 26.4%, because population growth outpaced student growth.
Growth came from younger students (including school students), regional and remote students, students with a disability and First Nations students. Full-time and female student numbers fell.
Apply one growth rate across all of that and you will be wrong in both directions at once. Some of your cohorts are growing faster than you've budgeted and others are shrinking faster than you've admitted.
Secondary summaries, such as eSkilled's, put program enrolments down 5.2% (2.96 million to 2.80 million) and international students down 4.6% (296,340 to 282,805). Treat those as pointers until you've checked them against the NCVER report. Don't put them in a board paper unverified.
Model each business separately
Most RTOs run several businesses under one registration. Forecast them that way.
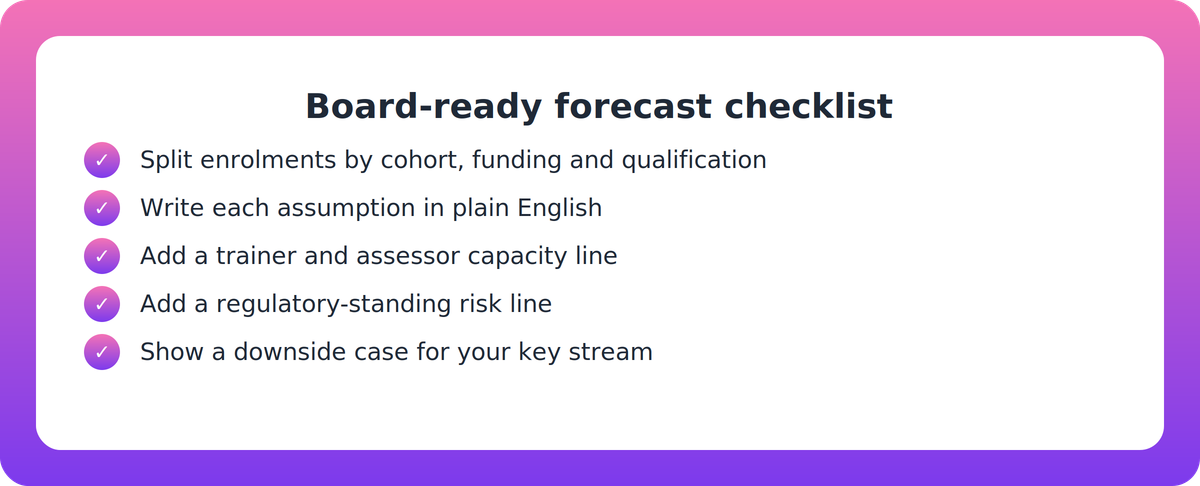
Split by cohort, funding source and qualification
Build the baseline at the level where behaviour differs:
- Cohort: school-age, young adult, mature-age, regional, learners with a disability, First Nations learners.
- Funding source: government-funded, fee-for-service, school-linked.
- Qualification: by AQF level and training package, not by faculty or department.
School-linked demand is a good example of why. NCVER's *VET in Schools 2025* recorded 412,840 program enrolments (up 4.8%) and 151,485 completions (up 6.4%), the highest since collection began in 2006. That is a different business from adult or funded delivery, with different buyers, timing and delivery models. Claire Field also notes that government-funded VET student numbers are in decline. A single blended line will hide both movements.
Read demand signals with care
The Jobs and Skills Australia 2026 Occupation Shortage List, as reported by Newbery Consulting and CAQA, found 279 occupations (27% of those assessed) in national shortage. That is down from 29% in 2025 and a 36% peak in 2023. Shortages remain concentrated among Technicians and Trades Workers (almost half) and Professionals (37%).
If your pipeline assumptions were keyed to shortage-driven demand at its peak, challenge them. Easing shortages may change which qualifications see demand. That is not a reason to abandon a trade-heavy portfolio. It is a reason to show the board which enrolments depend on that signal.
Cap the forecast with capacity and standing
A forecast is a demand number until you test it against supply. A Jobs and Skills Australia VET workforce study (October 2024) projected 3,800 more VET teachers needed over five years. If your enrolment target exceeds trainer and assessor supply, it isn't a forecast. It's a wish.
Regulatory standing is the other cap. The Standards for RTOs 2025 took effect on 1 July 2025. ASQA's Corporate Plan 2026–27 describes a shift from prescriptive compliance to outcome-based regulation that needs cultural change, and ASQA has taken qualification-integrity actions, including cancellations, during 2026. Secondary commentary says its risk priorities lead with qualification integrity and competency outcomes, alongside provider governance and training quality. Check the full list on ASQA's site.
Key people matter here too. One consultancy, VET Resources, reports that RTOs must notify ASQA within 10 business days of material changes such as ownership, key personnel, operations or third-party arrangements. ASQA has published a Statement of Regulatory Expectations on fit and proper person requirements and notification of material changes. Confirm the detail at the source before you rely on it. The planning point stands either way: losing a compliance lead is a forecast event.
A forecast your board can interrogate
You can do this before next quarter's board pack, with the data you already hold:
- Break last year's enrolments into cohort, funding source and qualification, and give each its own driver.
- Write down every assumption in plain English next to the number it supports.
- Add a capacity line: trainers and assessors available against delivery hours the forecast implies.
- Add a standing line: what happens to the pipeline if an audit finding, a key-person departure or a notification obligation lands mid-year.
- Show a downside case for the one cohort or funding stream you depend on most.
Key takeaways
- A flat national total (up 1,585 students) masked a 108,360 fall in qualification students. Mix, not volume, is where forecasts break.
- Forecast by cohort, funding source and qualification. School-linked, funded and fee-for-service activity are different businesses.
- Treat secondary figures as leads until verified against NCVER, JSA and ASQA.
- Cap every forecast with trainer and assessor capacity, and a regulatory-standing risk line under the Standards for RTOs 2025.
- A board-ready forecast shows its assumptions and what would break it.
Our take
The best forecast isn't the most accurate one. It's the one whose assumptions are visible, owned by more than one person, and honest about what would break it.
Most RTO forecasts fail quietly. They aren't wildly wrong. They're unexaminable: one spreadsheet, one author, one growth rate. A board can't challenge what it can't see, and neither can you.
Here is a first step for this week. Pick the single cohort or funding stream your margin leans on hardest and ask: if it fell 15%, who in the business would know first, and where would they see it?
FAQ
Why do most RTO enrolment forecasts miss?
They extrapolate last year's intake and treat the market as one number. In 2025, total VET students were almost flat (up 1,585), but qualification students fell by 108,360 while younger, regional, disability and First Nations cohorts grew. One growth rate can't capture that.
What should an RTO enrolment forecast be segmented by?
Cohort, funding source and qualification at a minimum. School-linked activity, government-funded delivery and fee-for-service behave differently and should be modelled separately, each with its own assumptions.
How should regulatory risk appear in a forecast?
As an explicit line. The 2025 Standards took effect on 1 July 2025 and ASQA has taken qualification-integrity actions in 2026. Model what an audit finding, governance issue or key-personnel change would do to your ability to enrol and issue credentials.
Which figures should I verify before they go to the board?
Anything from secondary commentary, including program enrolment percentages, shortage-list figures and notification timeframes. Check them against NCVER, Jobs and Skills Australia and ASQA directly.